Hypothesis testing with Tutti Frutti
Tutti Frutti used to be my favourite candy. I haven't eaten it in a while but one day I somehow got curious whether the types of candies are distributed evenly. There are 9 possible types of candy (3 colours and 3 shapes), so the proportion of each should be 1/9. But is it?
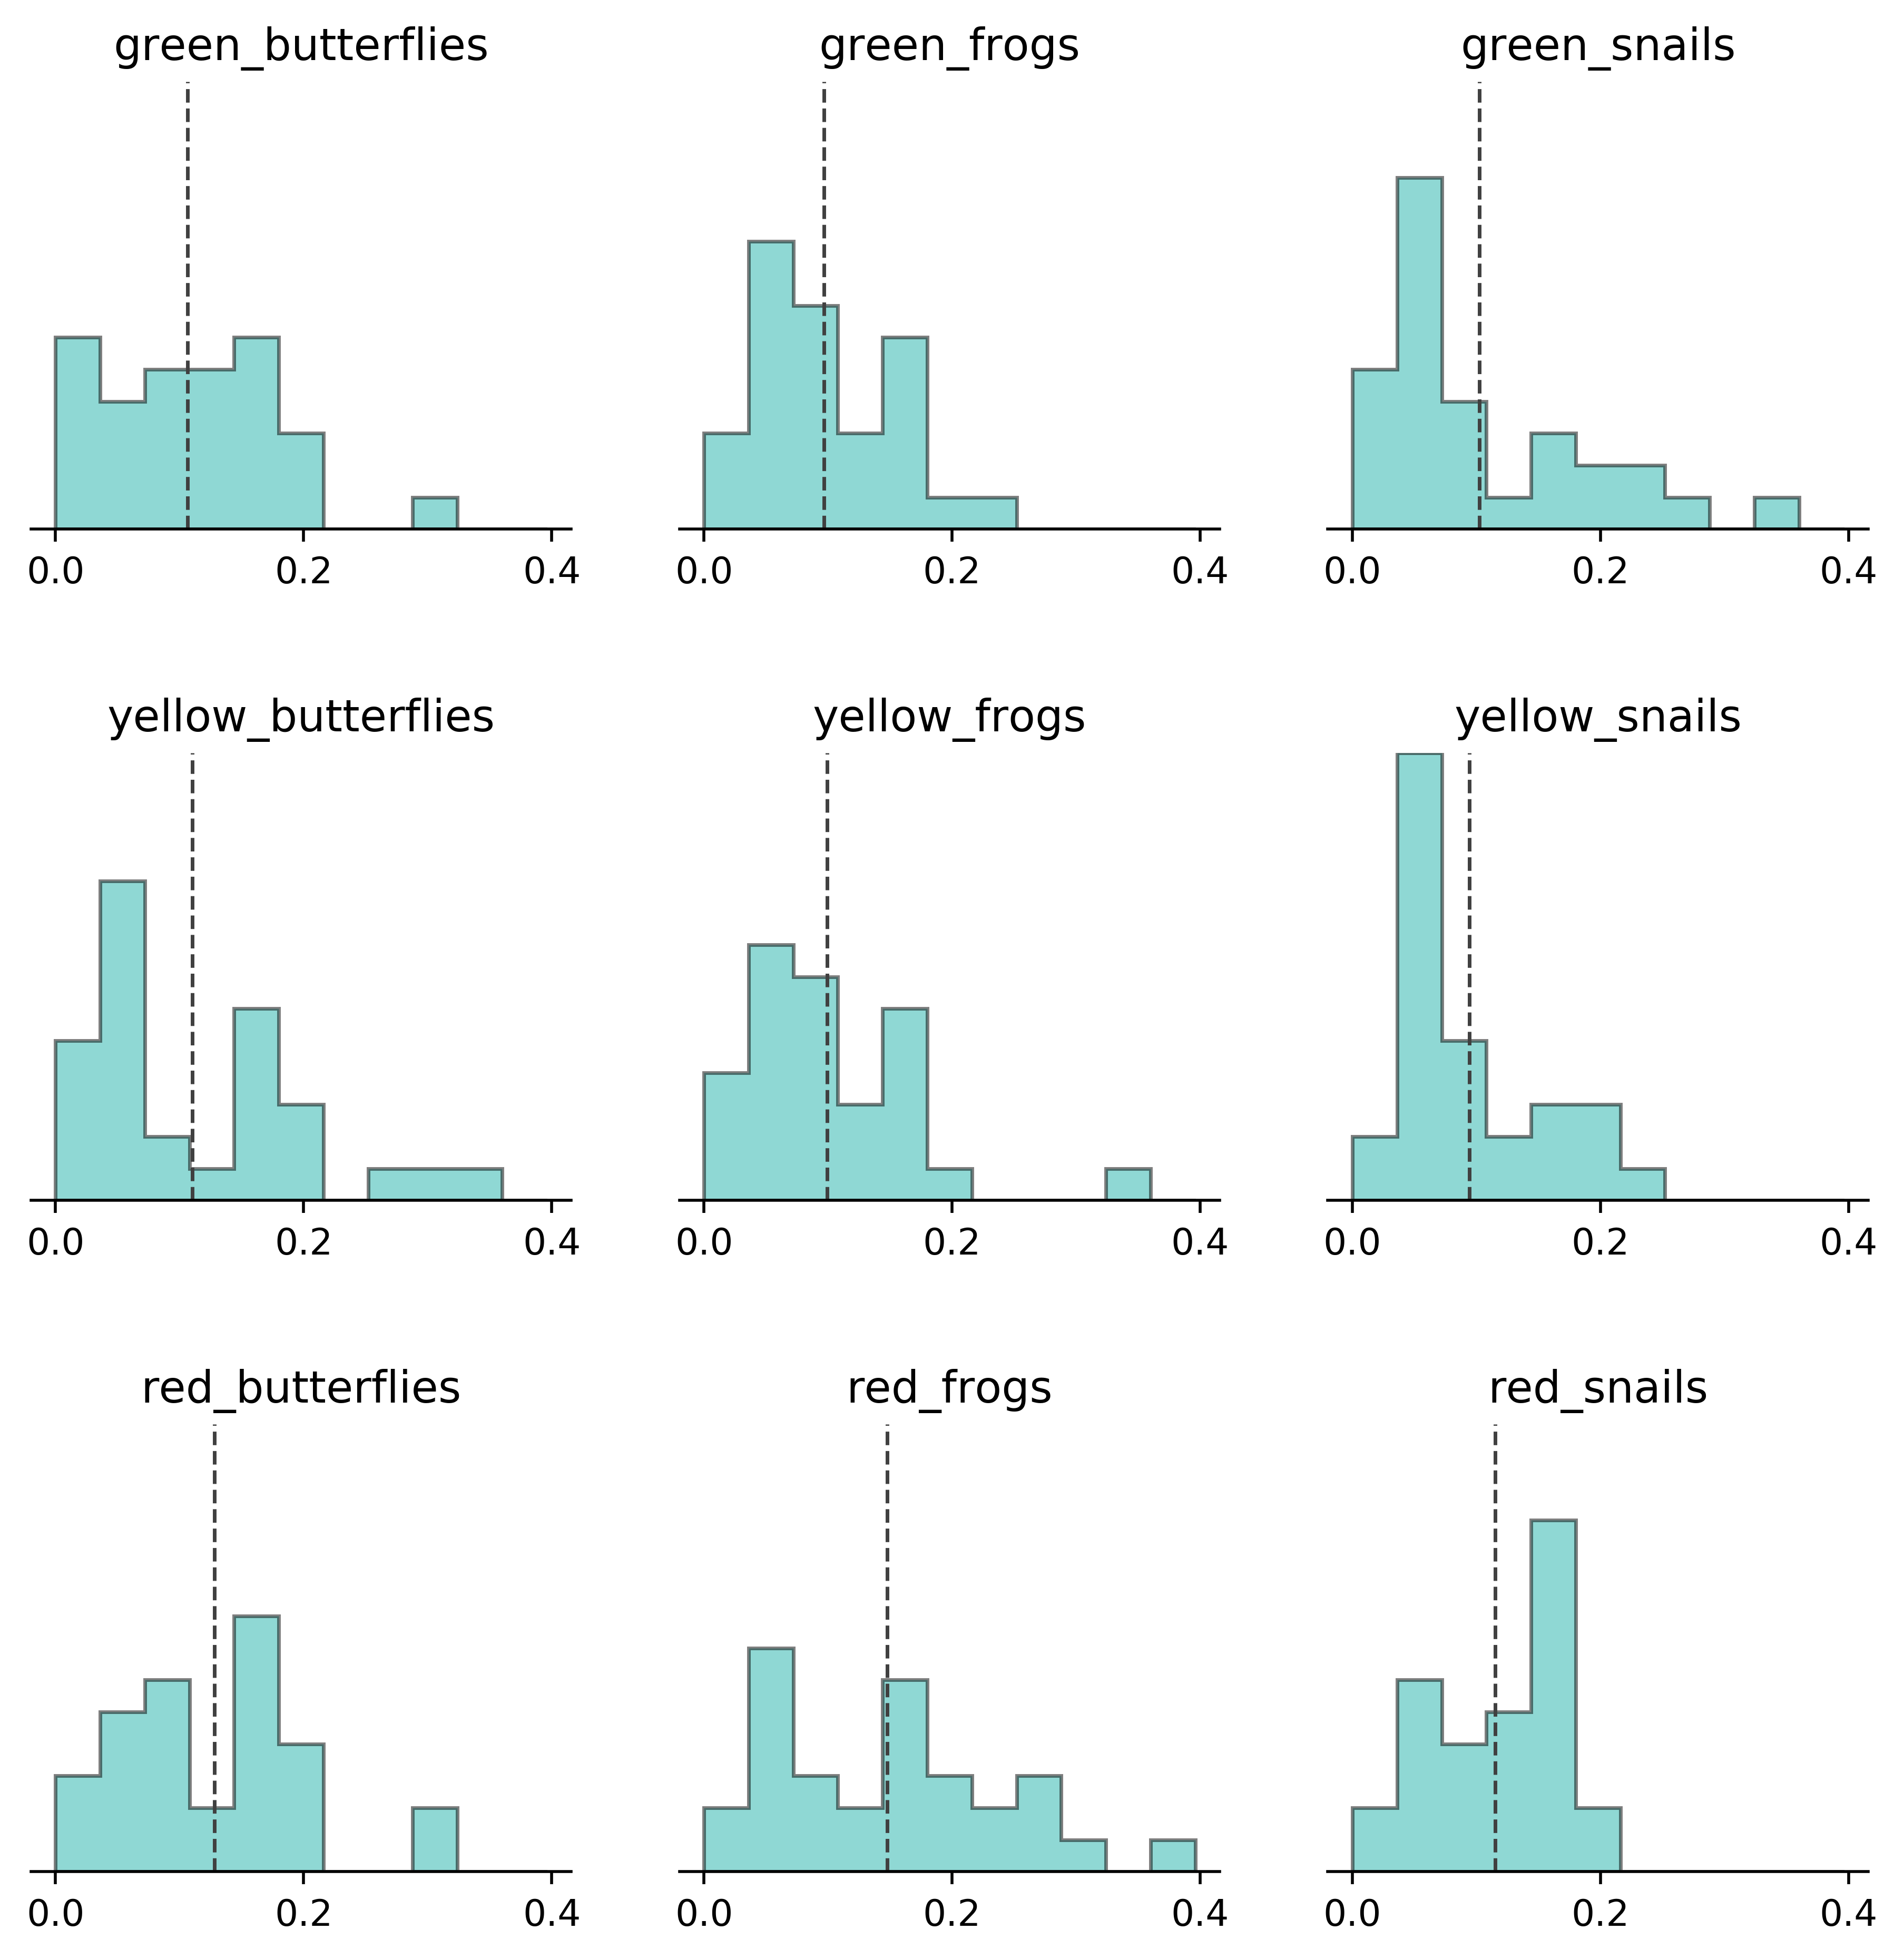
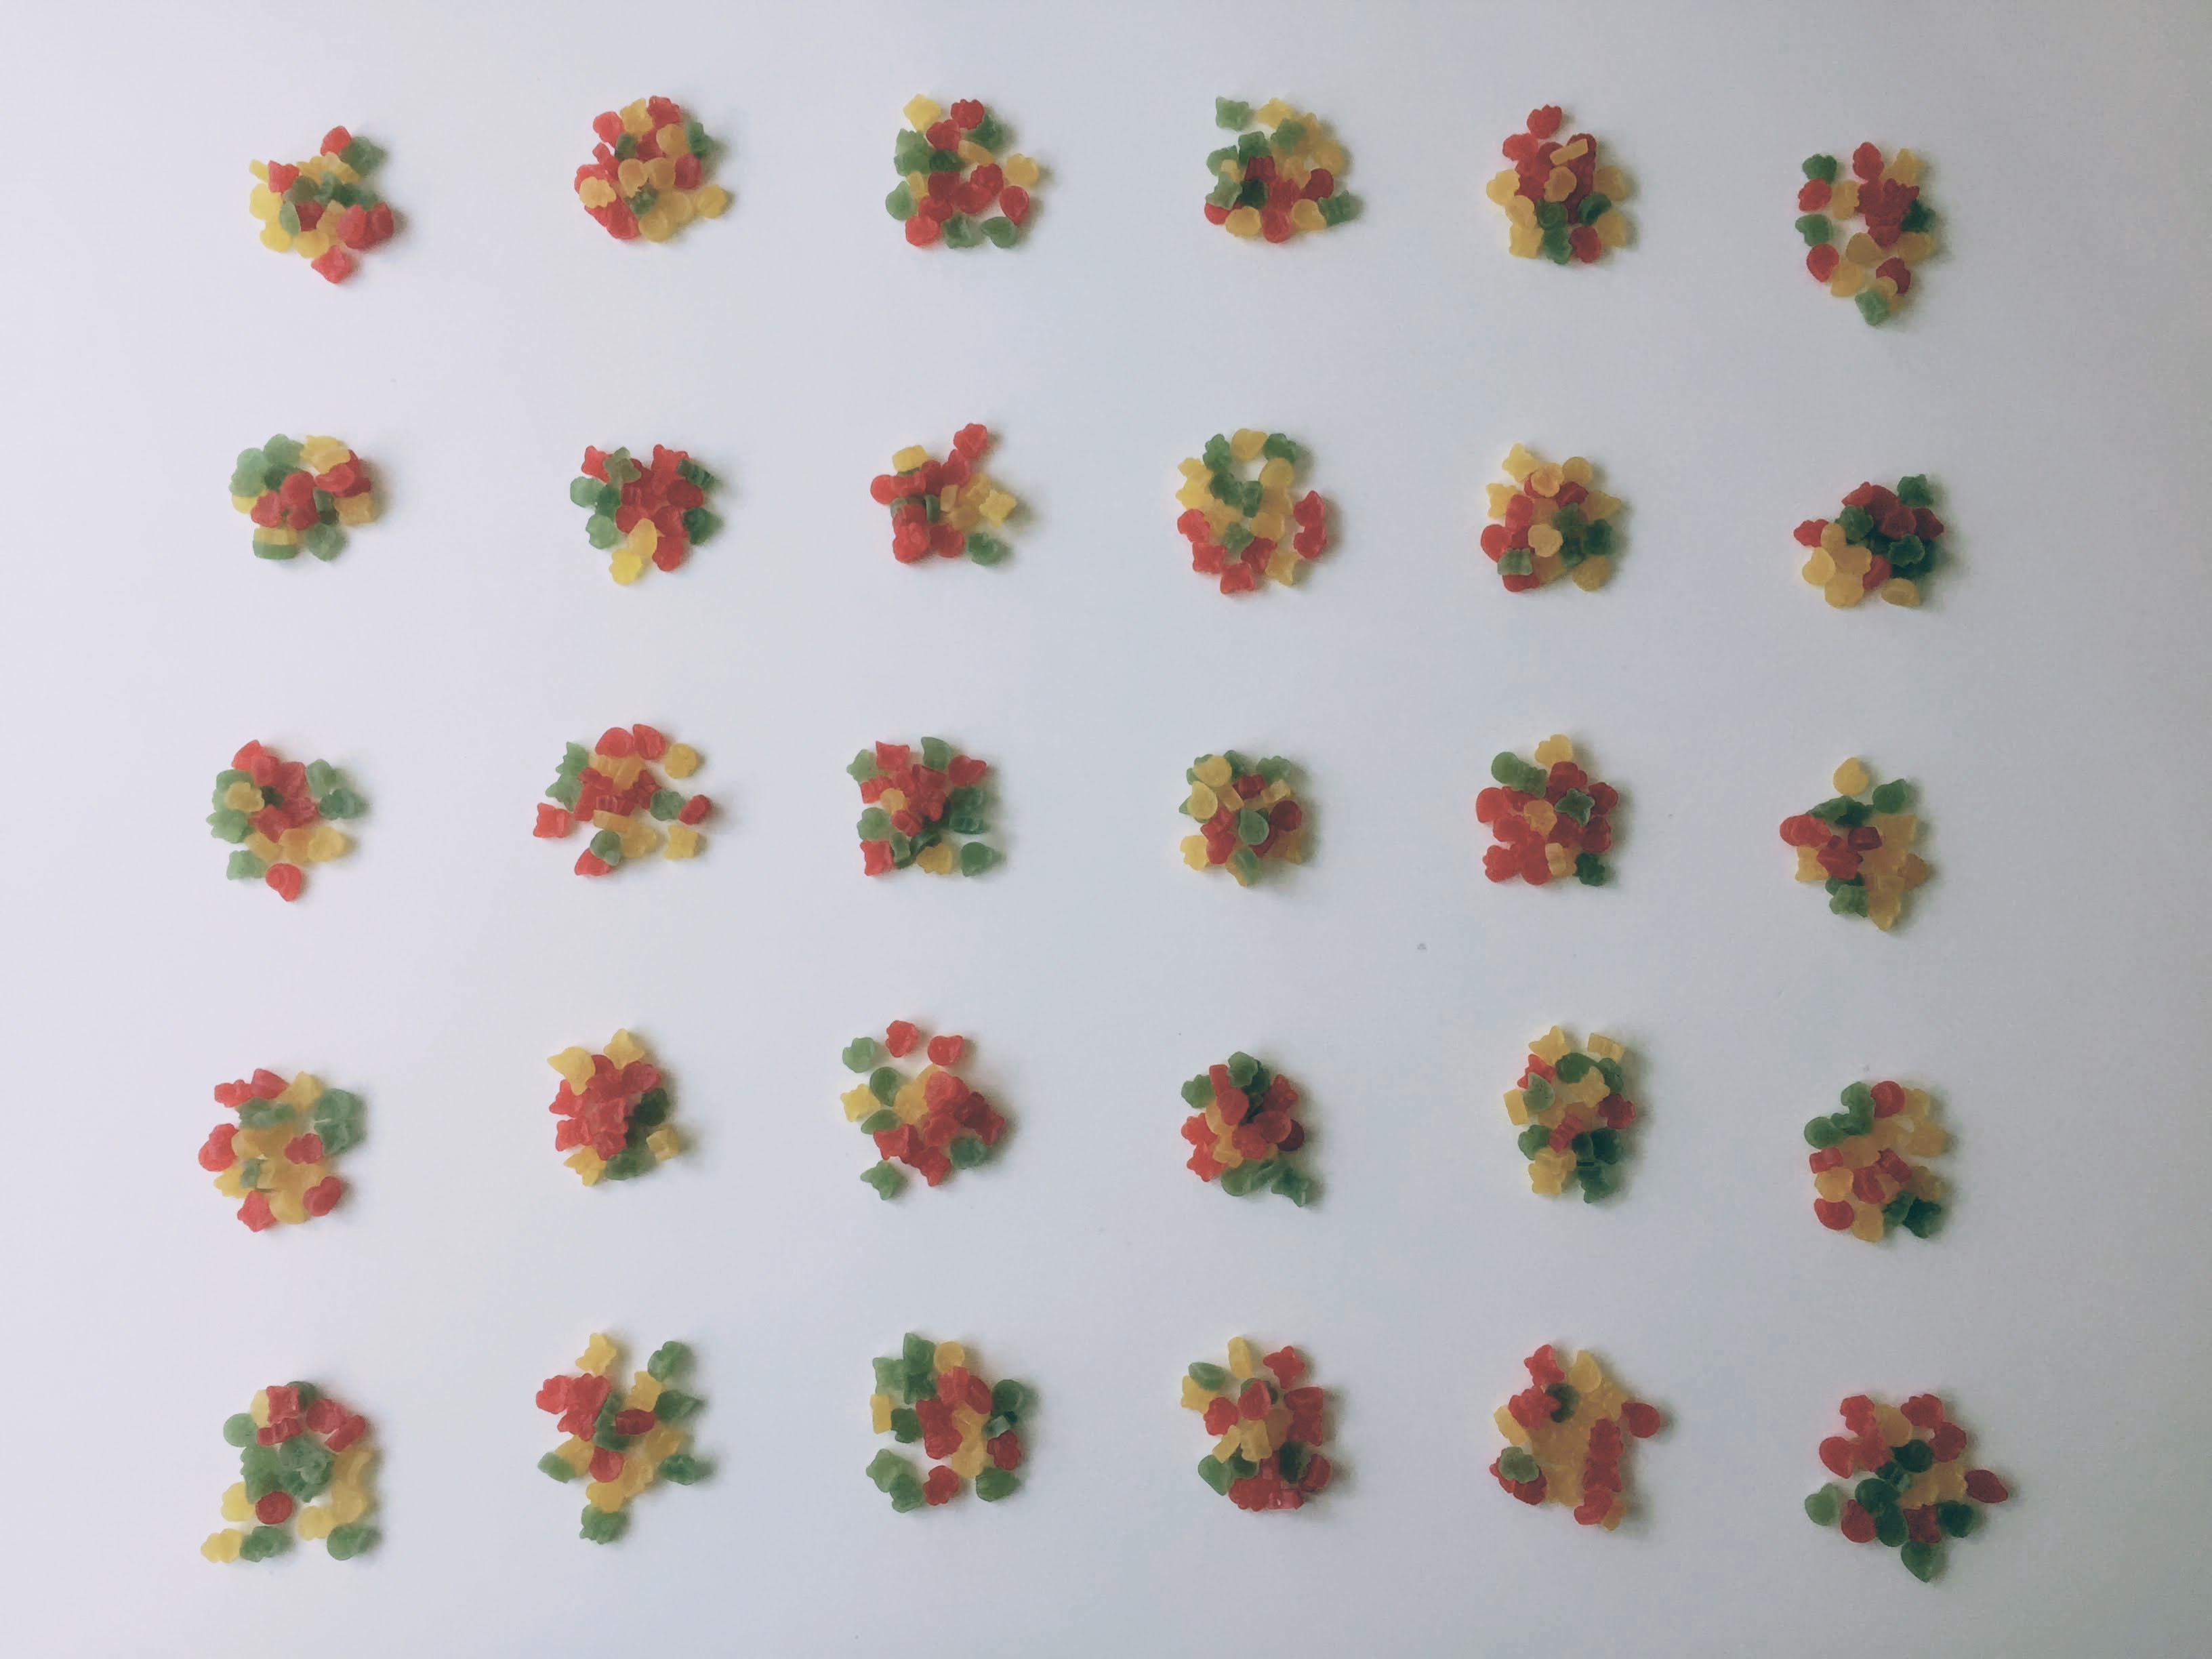
To answer this question, I bought 30 packs of Tutti Frutti. I then counted the number of each type of candy in each pack and recorded the results in a spreadsheet. After that, I conducted a hypothesis test for each type of candy to determine if the proportion of that type is significantly different from what is expected (which is 1/9).
It turned out that most of the candy types are evenly distributed, except for one. There are more red frogs (M = 14.8%, SD = 9.5%) than the population norm 11.1%, t(29) = 2.1006, p = .0445. This is enough evidence to reject the null hypothesis under alpha = 0.05.
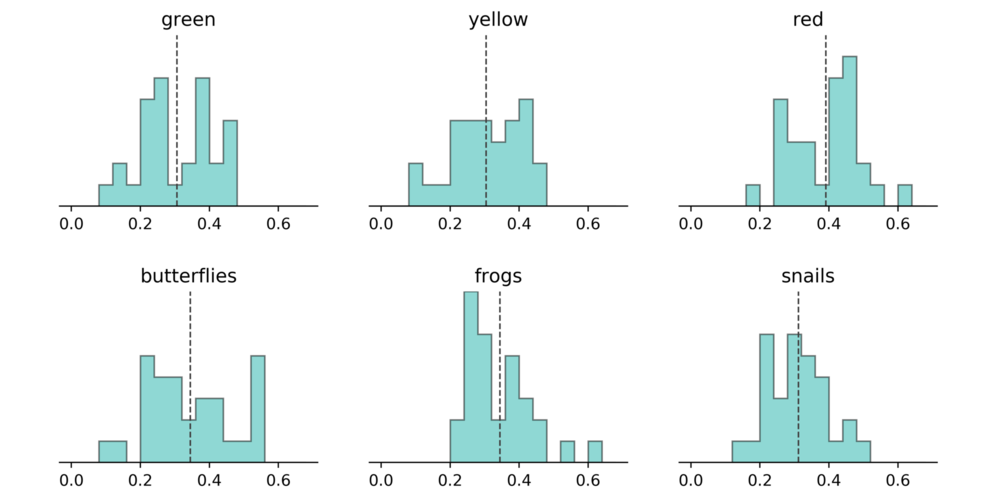
I then performed the same analysis for each colour and shape as well. Turns out that in general there are more red coloured Tutti Fruttis (M = 39.1%, SD = 10.2%) than others, t(29) = 3.0931, p = 0.0044.