Where is the most likely place to have your phone stolen?
There is this interesting data set called "Offences Against Public Order and Offences Committed in Public Places" which is managed by the Police and Border Guard Board. It contains all the reported offences (mostly stealings and vandalism) from 2012 until today. What interesting thing can be found out based on this data set?
This time, I was curious about mobile phone stealings and if their nature has changed over time. For this, I filtered out all cases connected to mobile phones and ran two logistic regressions, one for the period of 2012-2013 and the other for 2019-2020. Then I was able to compare how the coefficients of both models have changed.
It turned out that:
- It used to be that being in the city centre increased the odds of having your mobile phone stolen. These days, it is not so.
- There also used to be a number of places which increased the odds of having your phone stolen: car park, cloakroom, nightclub, public transport, restaurant, street.
- During 2019-2020, summertime and Saturday are increasing the odds.
- Time of day (day/night) plays no significant role in neither of the time periods.
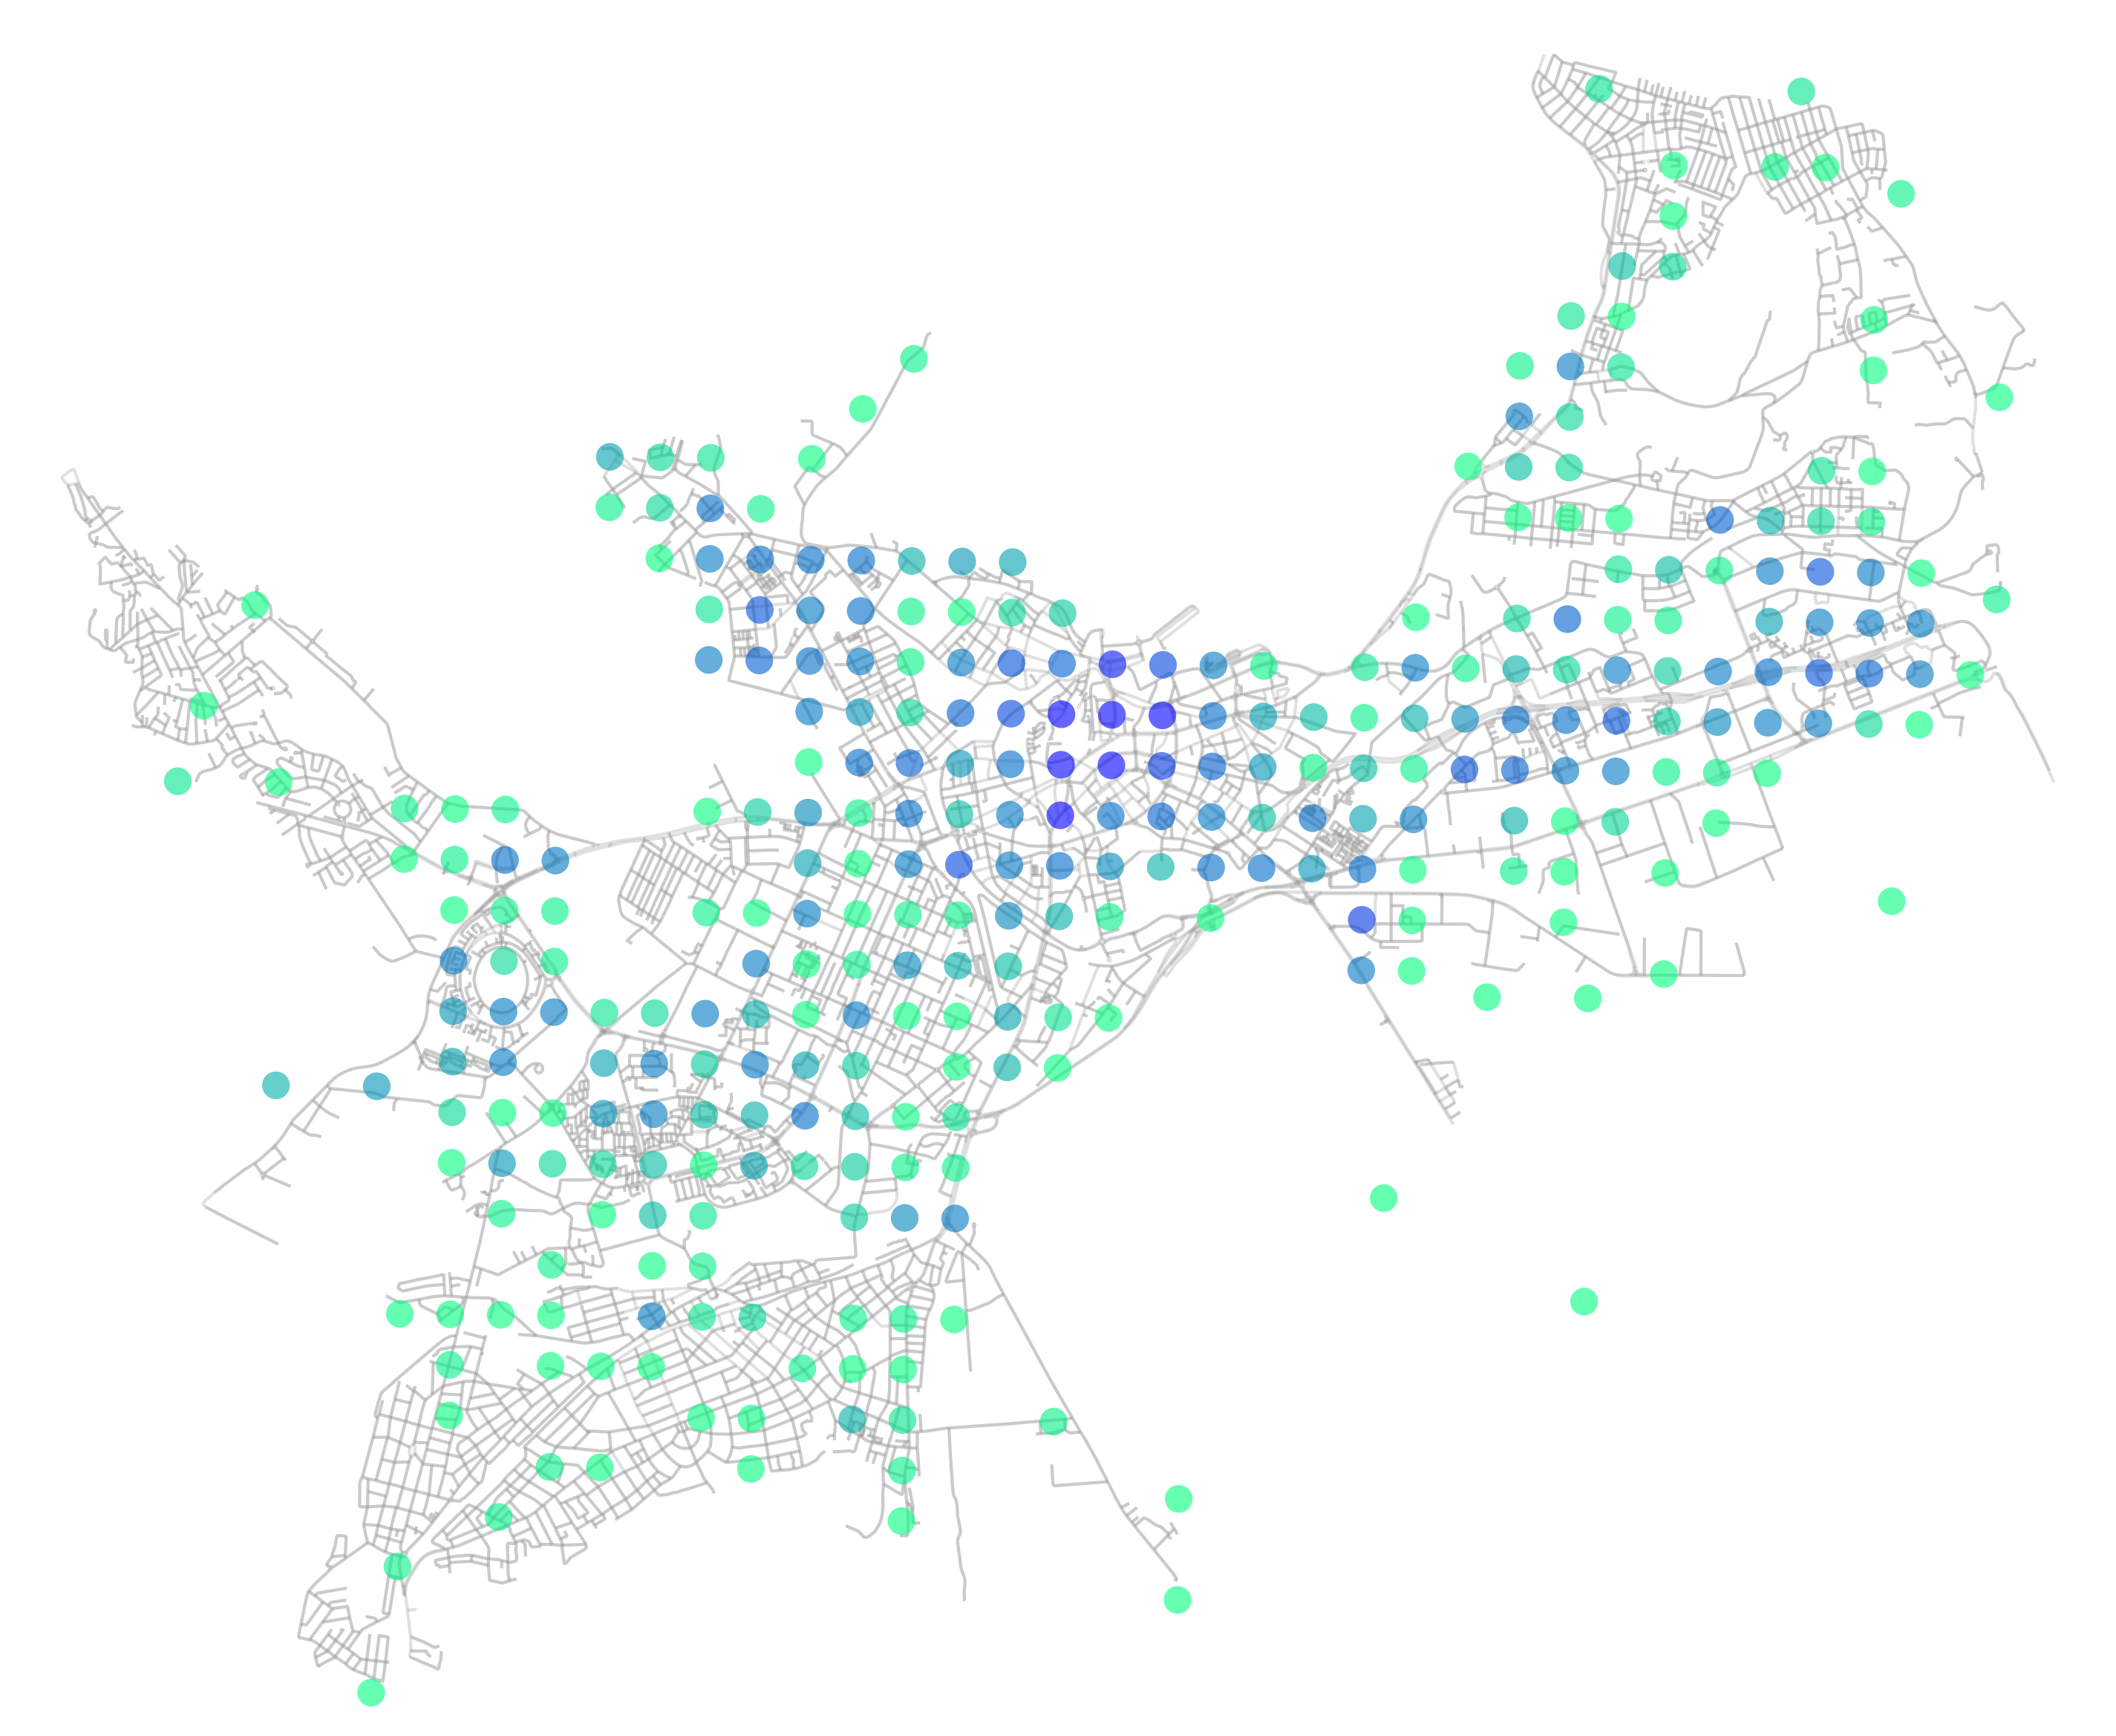
Below is also a map of all the locations where mobile phones have been reported stolen in 2019 and 2020. Dark blue represents more incidents reported in that place. Since the coordinates in the data set were given as a range, they form this kind of grid when plotted on a map.