Mood of music streamed on Spotify
Inspired by an article by The Economist which looked into the data on mood of music streamed, I also wanted to dig into it and see what the data says about Estonia.
Every song on Spotify has a number of features which are available via their developer API. Among other things (energy, danceability, tempo and more) is a feature called valence. Valence is a measure from 0.0 to 1.0 describing the musical positiveness conveyed by a track. Tracks with high valence sound more positive (e.g. happy, cheerful, euphoric), while tracks with low valence sound more negative (e.g. sad, depressed, angry).
Before starting with any analysis I needed to get the data. I first scraped the daily 200 most streamed songs from spotifycharts.com, that has data since 2017 on about 70 different countries. I then fetched the valence score for all the songs and that was it.
The main questions I wanted to answer with the data were:
- How does the mood of music streamed in Estonia compare to the rest of the world?
- When is the streamed music the saddest in Estonia? When is it the happiest?
- Can we see any change in the mood of music due to the pandemic?
Analysis
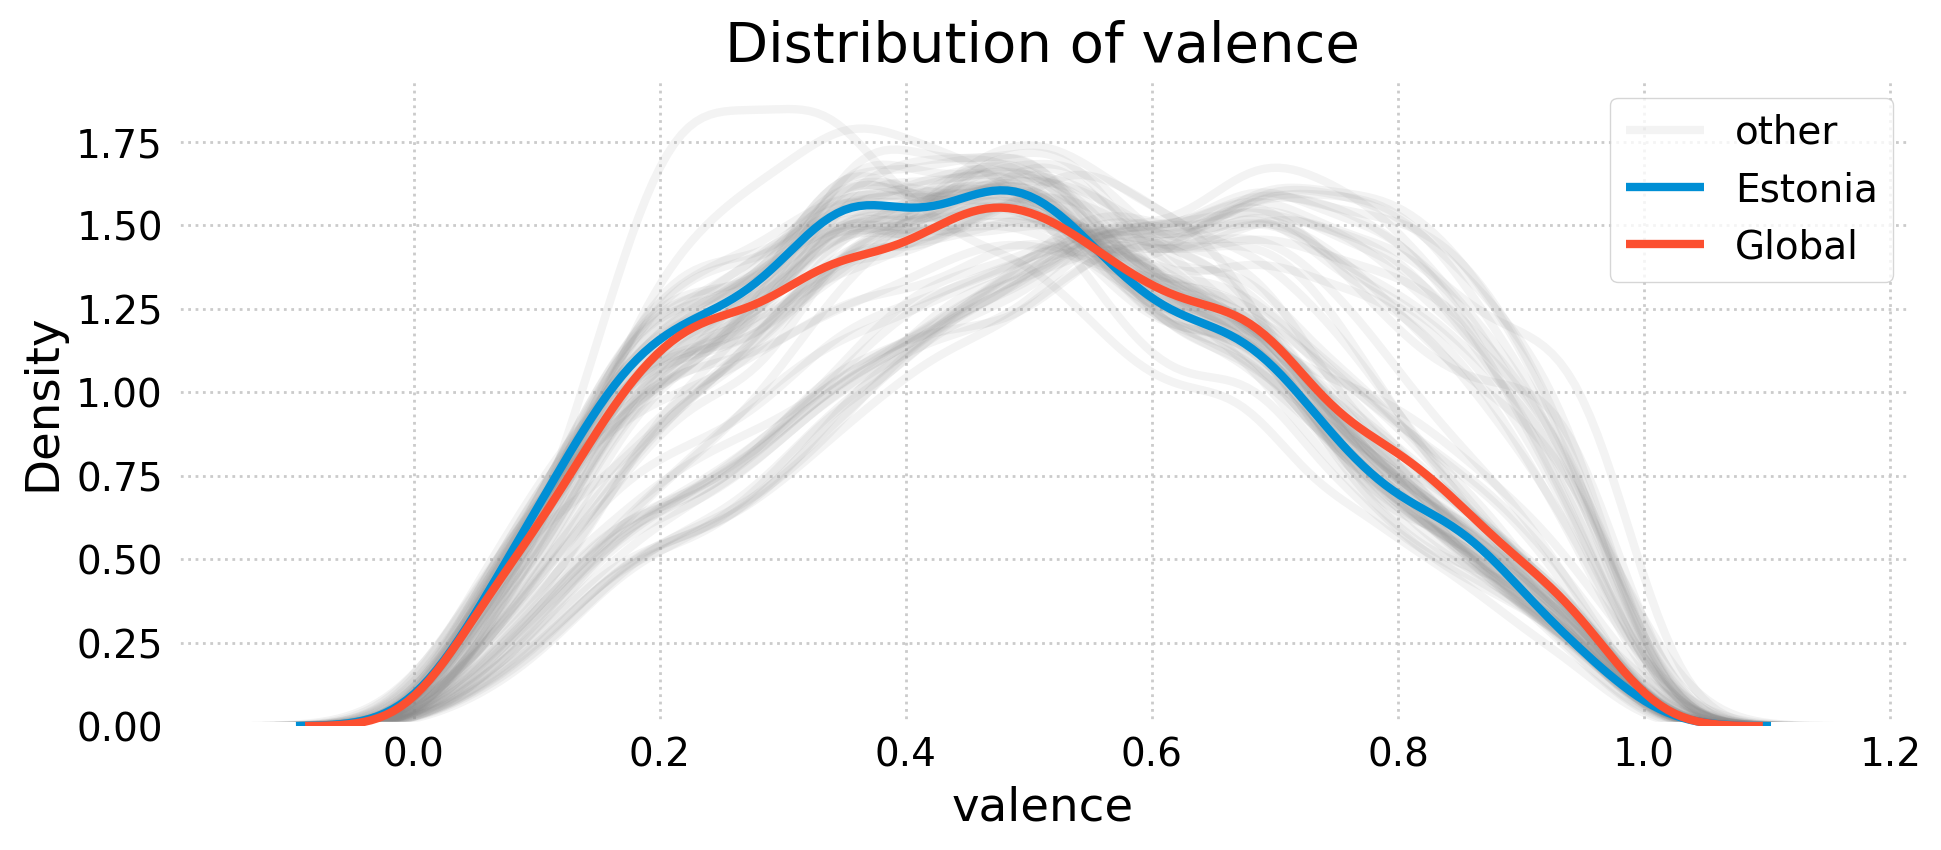
First, let's have a look at the distribution of the valence score.
On the chart below you can see the distributions for Estonia and the world highlighted (all other countries are gray). Both distributions look normal, meaning that most songs that are streamed have an average score of about 0.5.
What sticks out is that there are some countries where the distribution is skewed to the left. Let's see who are those countries that tend to stream more positive music.
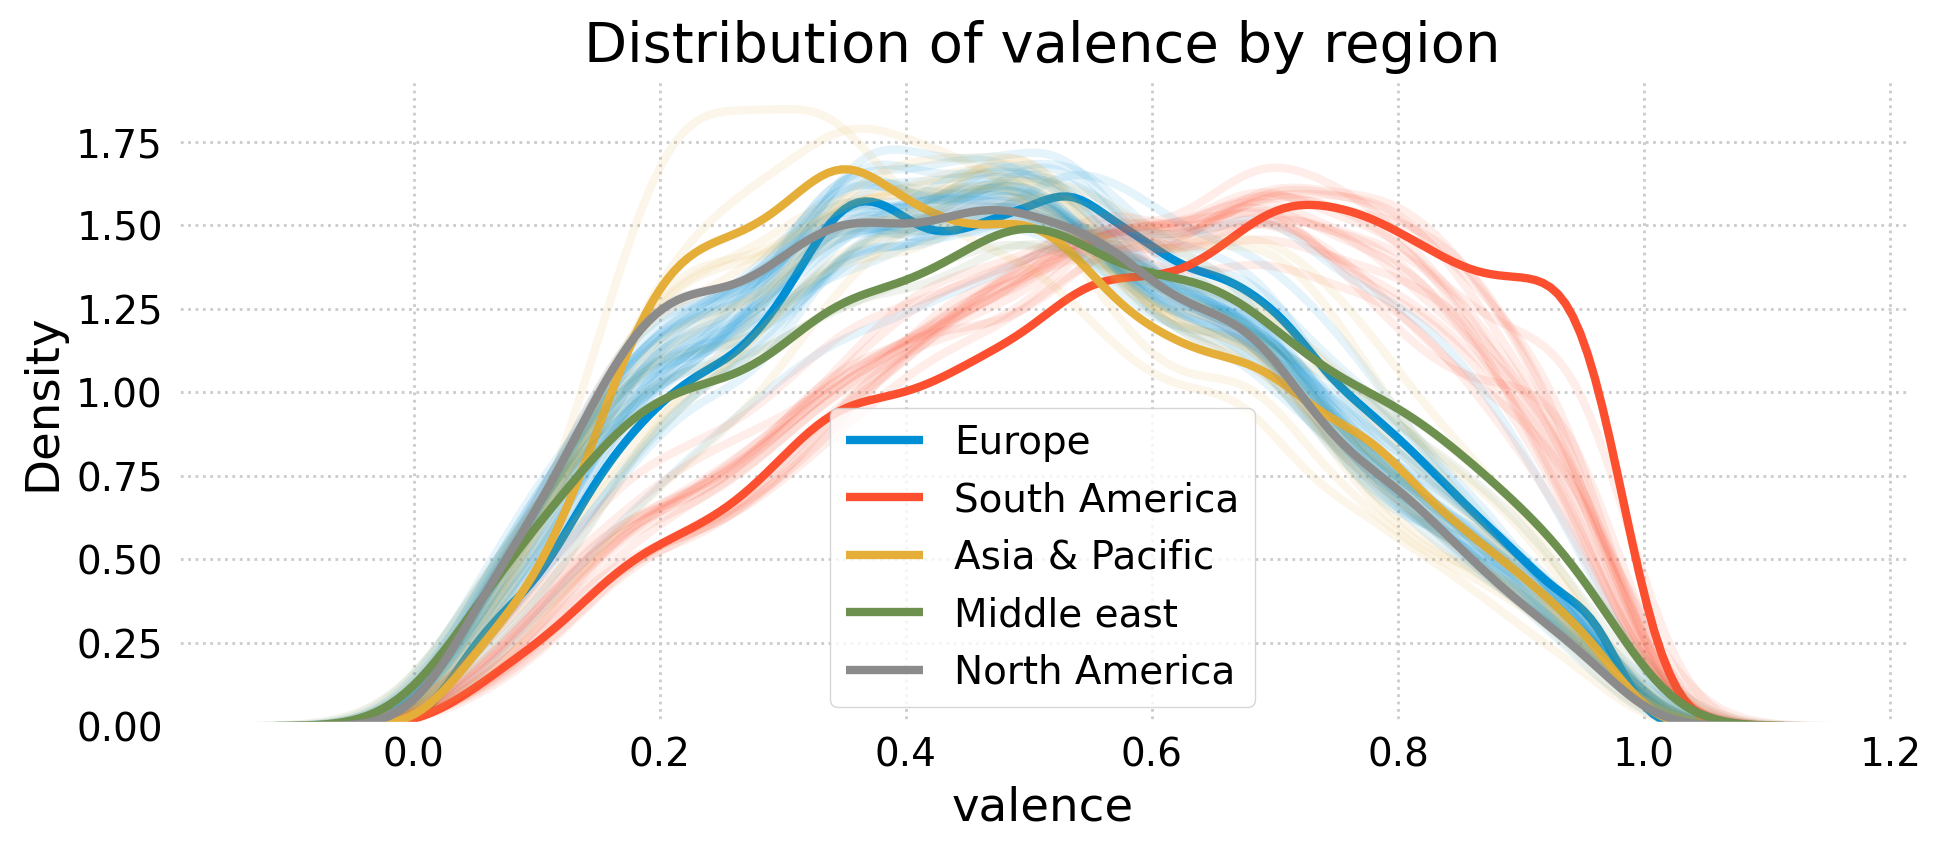
Below is the same distribution chart as above, but now every region is highlighted. The clear outlier is South America, where the music streamed is noticeably more positive compare to other regions.
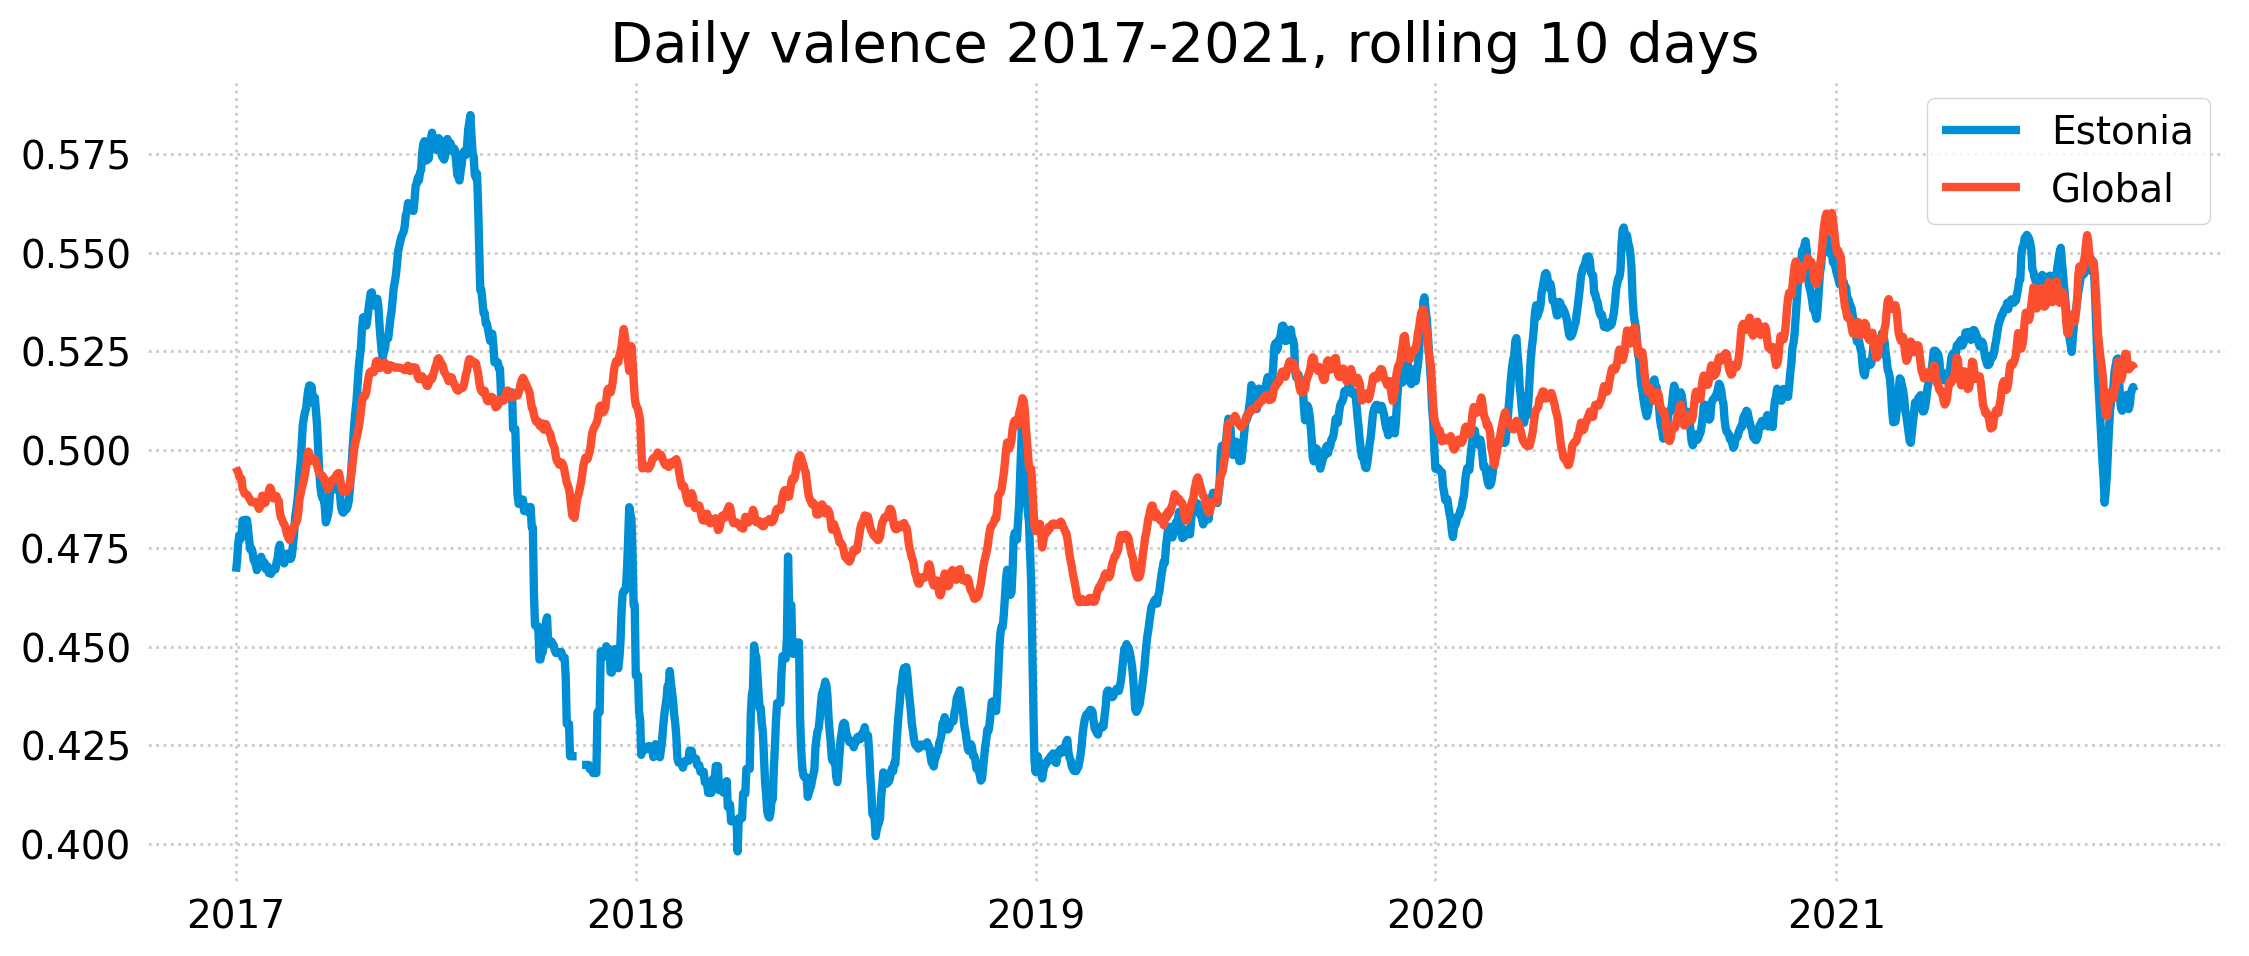
Let's now see what the average valence has been over time in Estonia and globally (chart below).
There is some missing data for Estonia in 2017 and 2018 but we can still see the overall trend. Immediately we can sees the peak in the middle of 2017 which ends quite rapidly, the whole 2018 is noticeably less happy compared to the rest of the years. It would be interesting to research further what's causing this volatility.
In terms of the pandemic, nothing obvious sticks out. If anything, we can see the elevated levels of valence in the spring of 2020 when the first wave was is full swing.
What we can also see from this chart are the peaks in the middle and at the end of each year - happier music is streamed in the summer and during the holiday season.
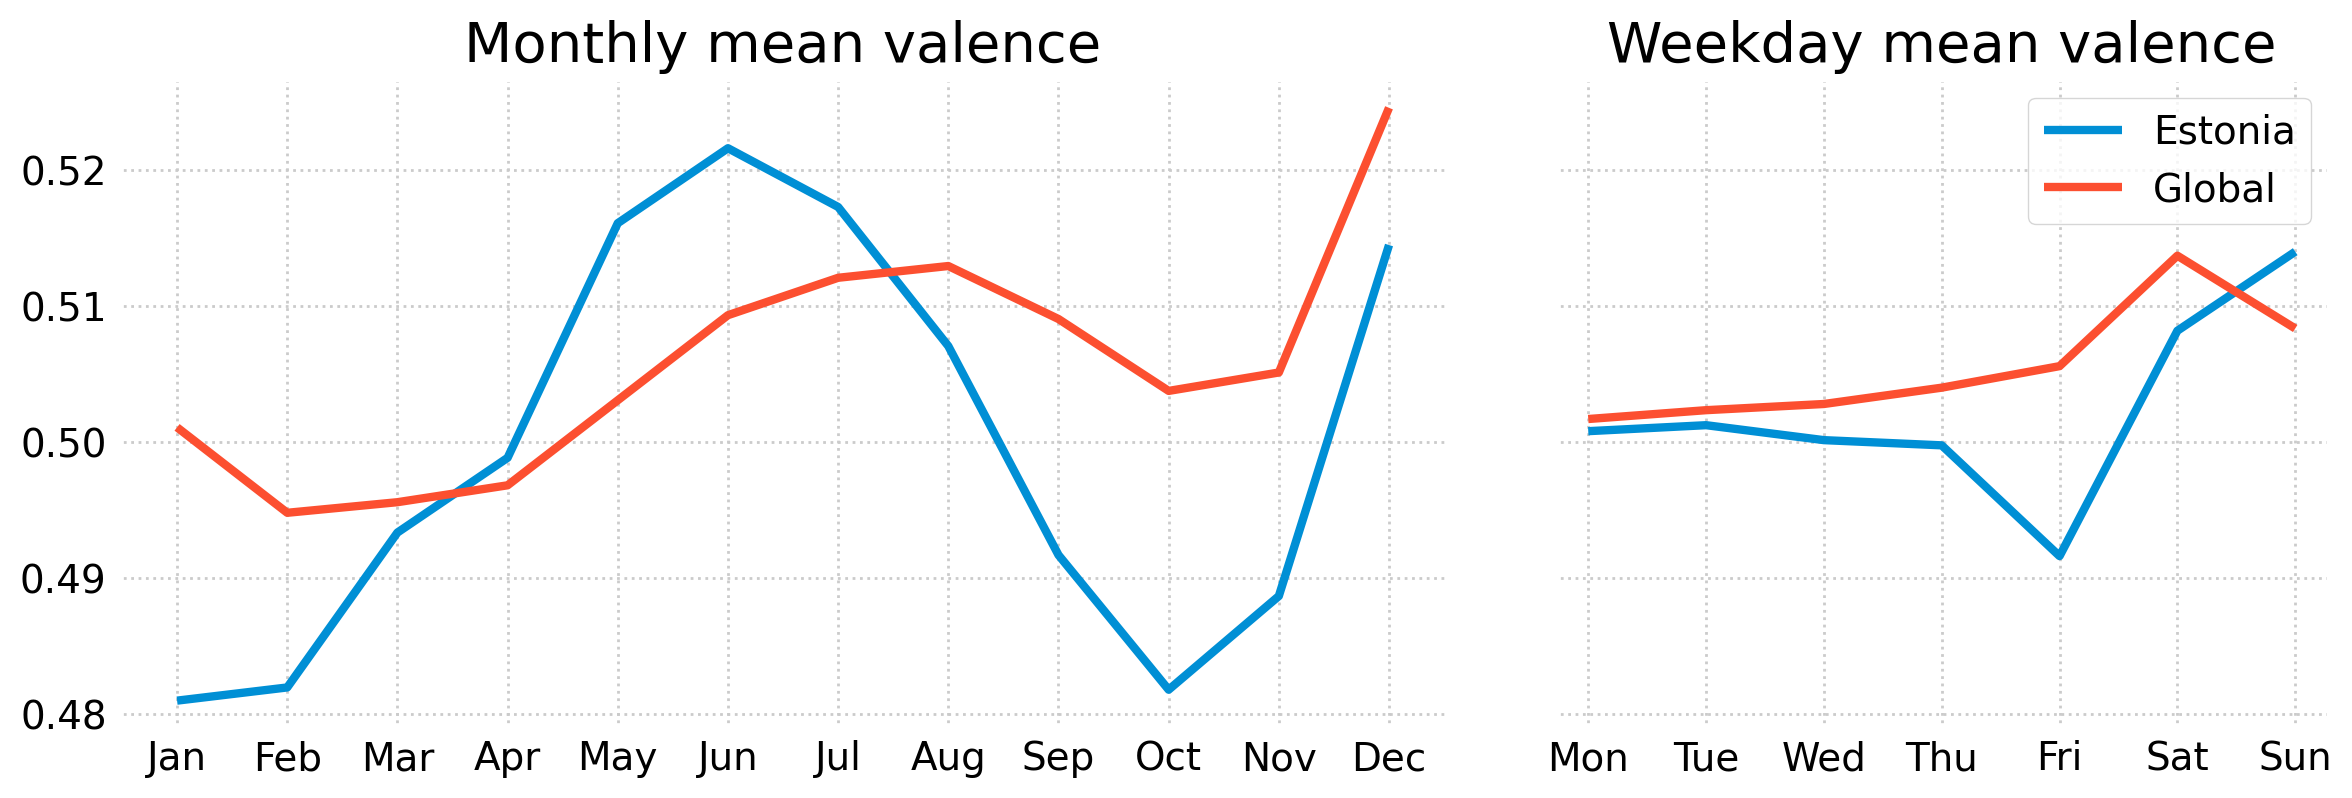
When aggregating the data on a monthly level then for Estonia, the summer and Christmas spikes are obvious. Globally, the mean valence is less volatile.
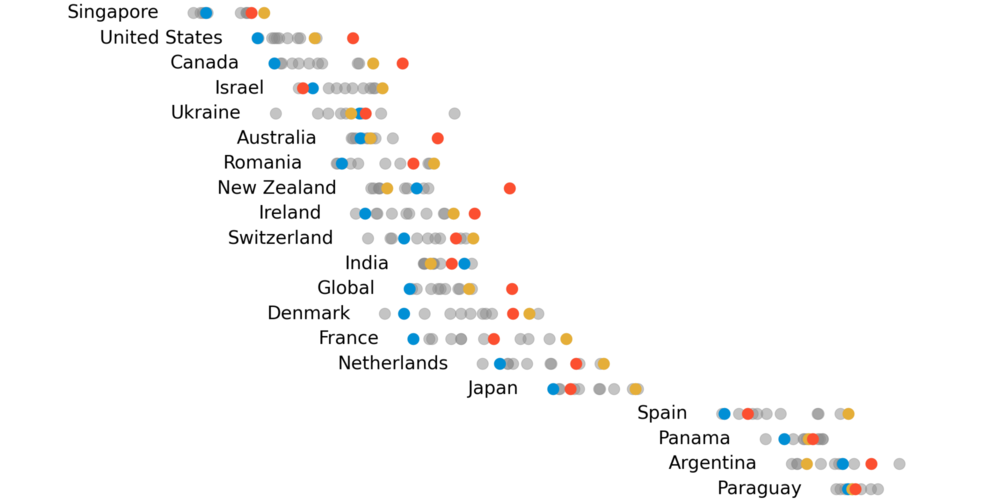
In terms of weekday, we can see that globally happier music is listened on the weekend. In Estonia, Friday seems to be a very sad day. This could be question to be researched further.
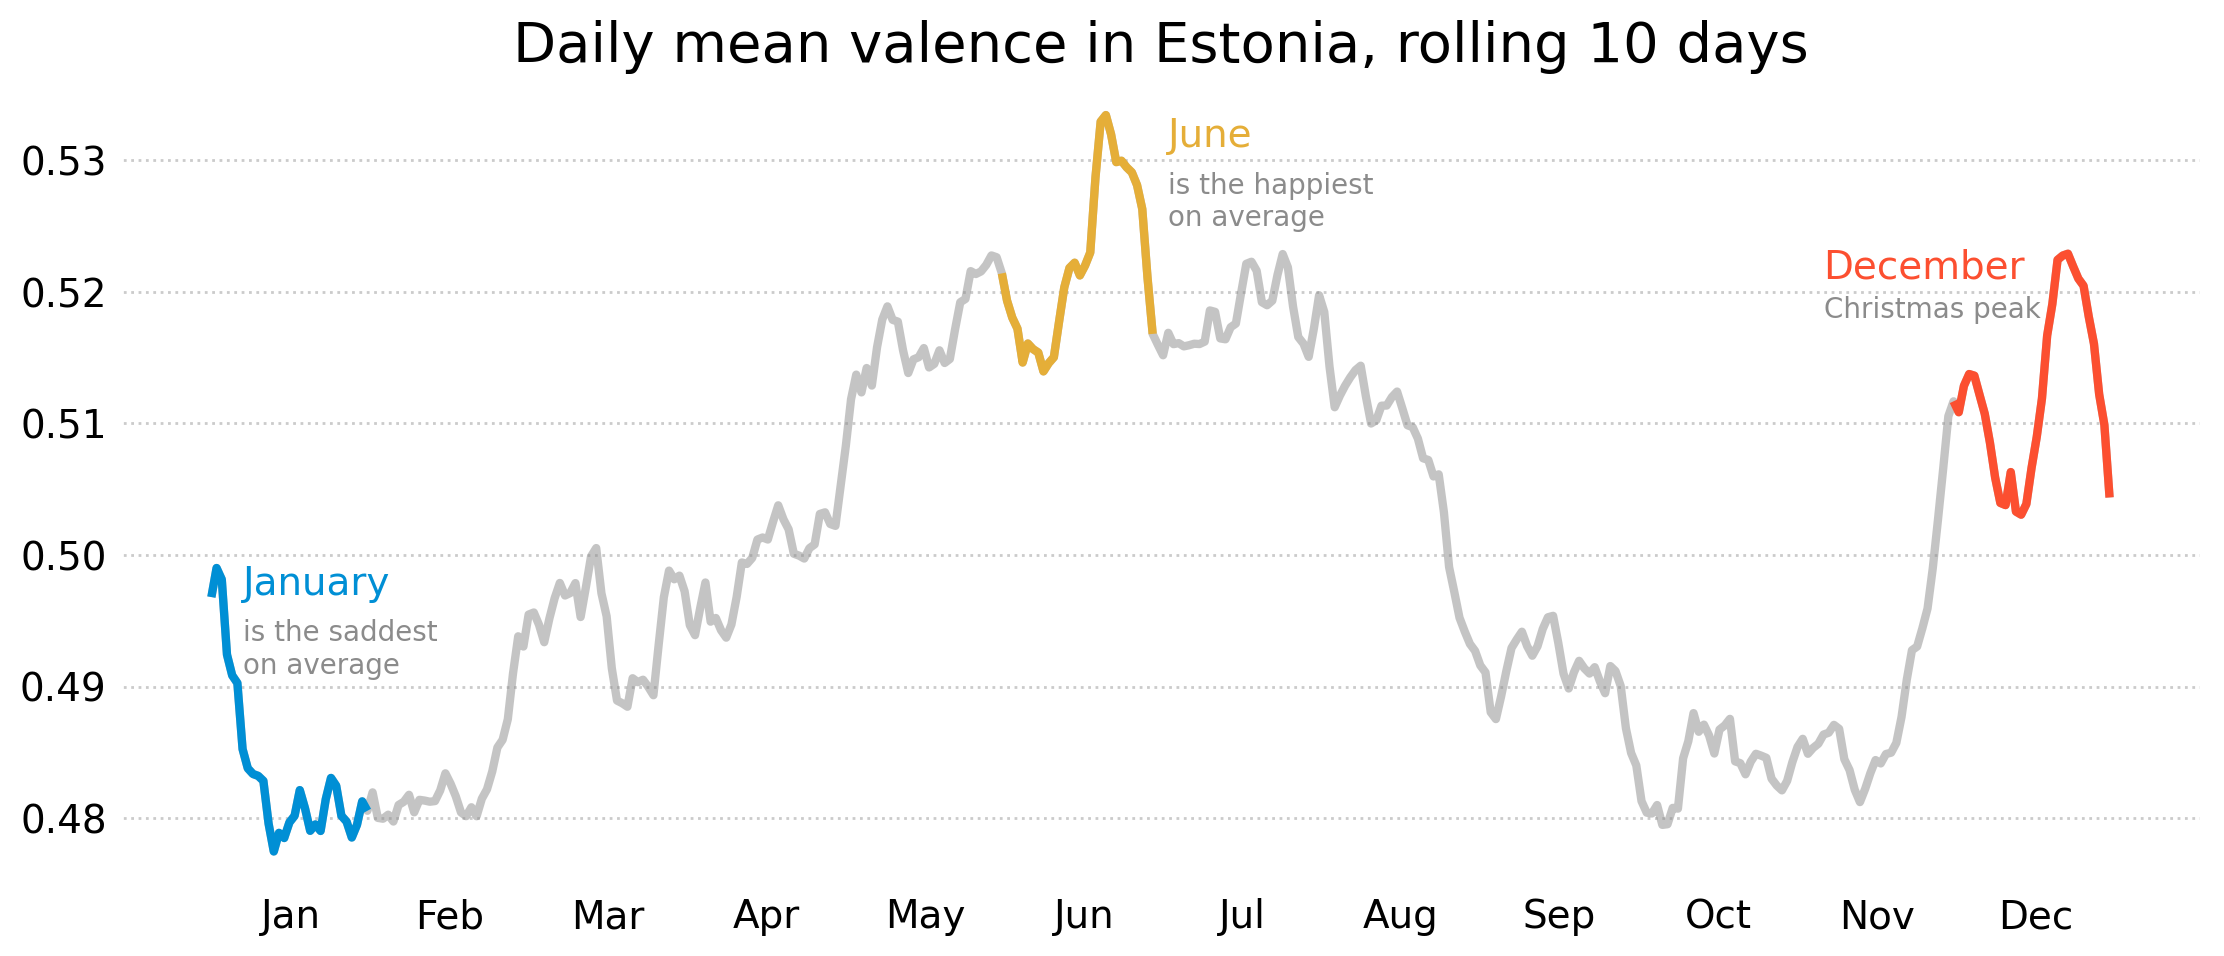
Below is a chart illustrating the mean valence over a year. On average, January is the saddest month and June is the happiest (probably because of Midsummer's Day).
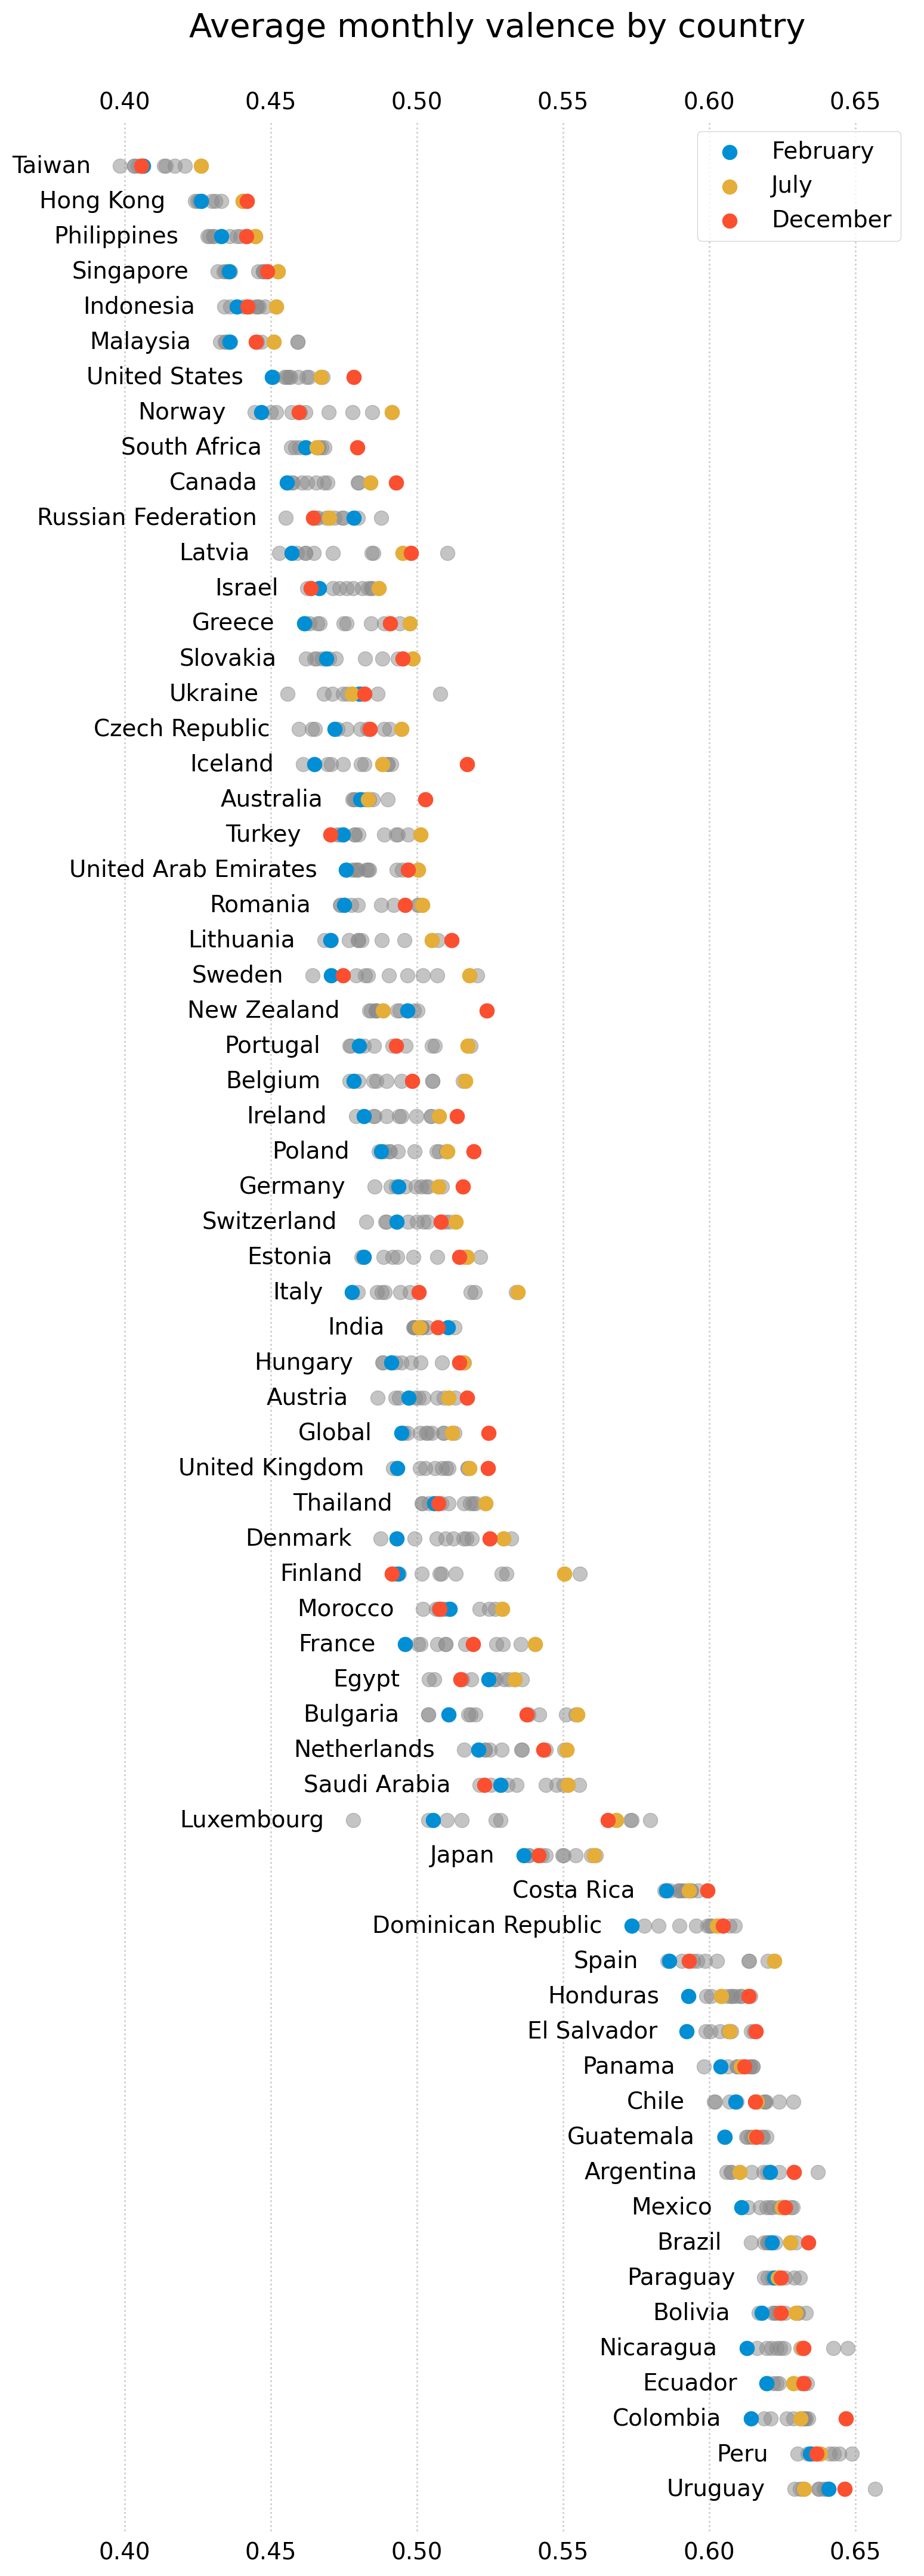
Over all the countries, the happiest month is July where February is the saddest. Below is a chart showing the monthly mean valence in each country.
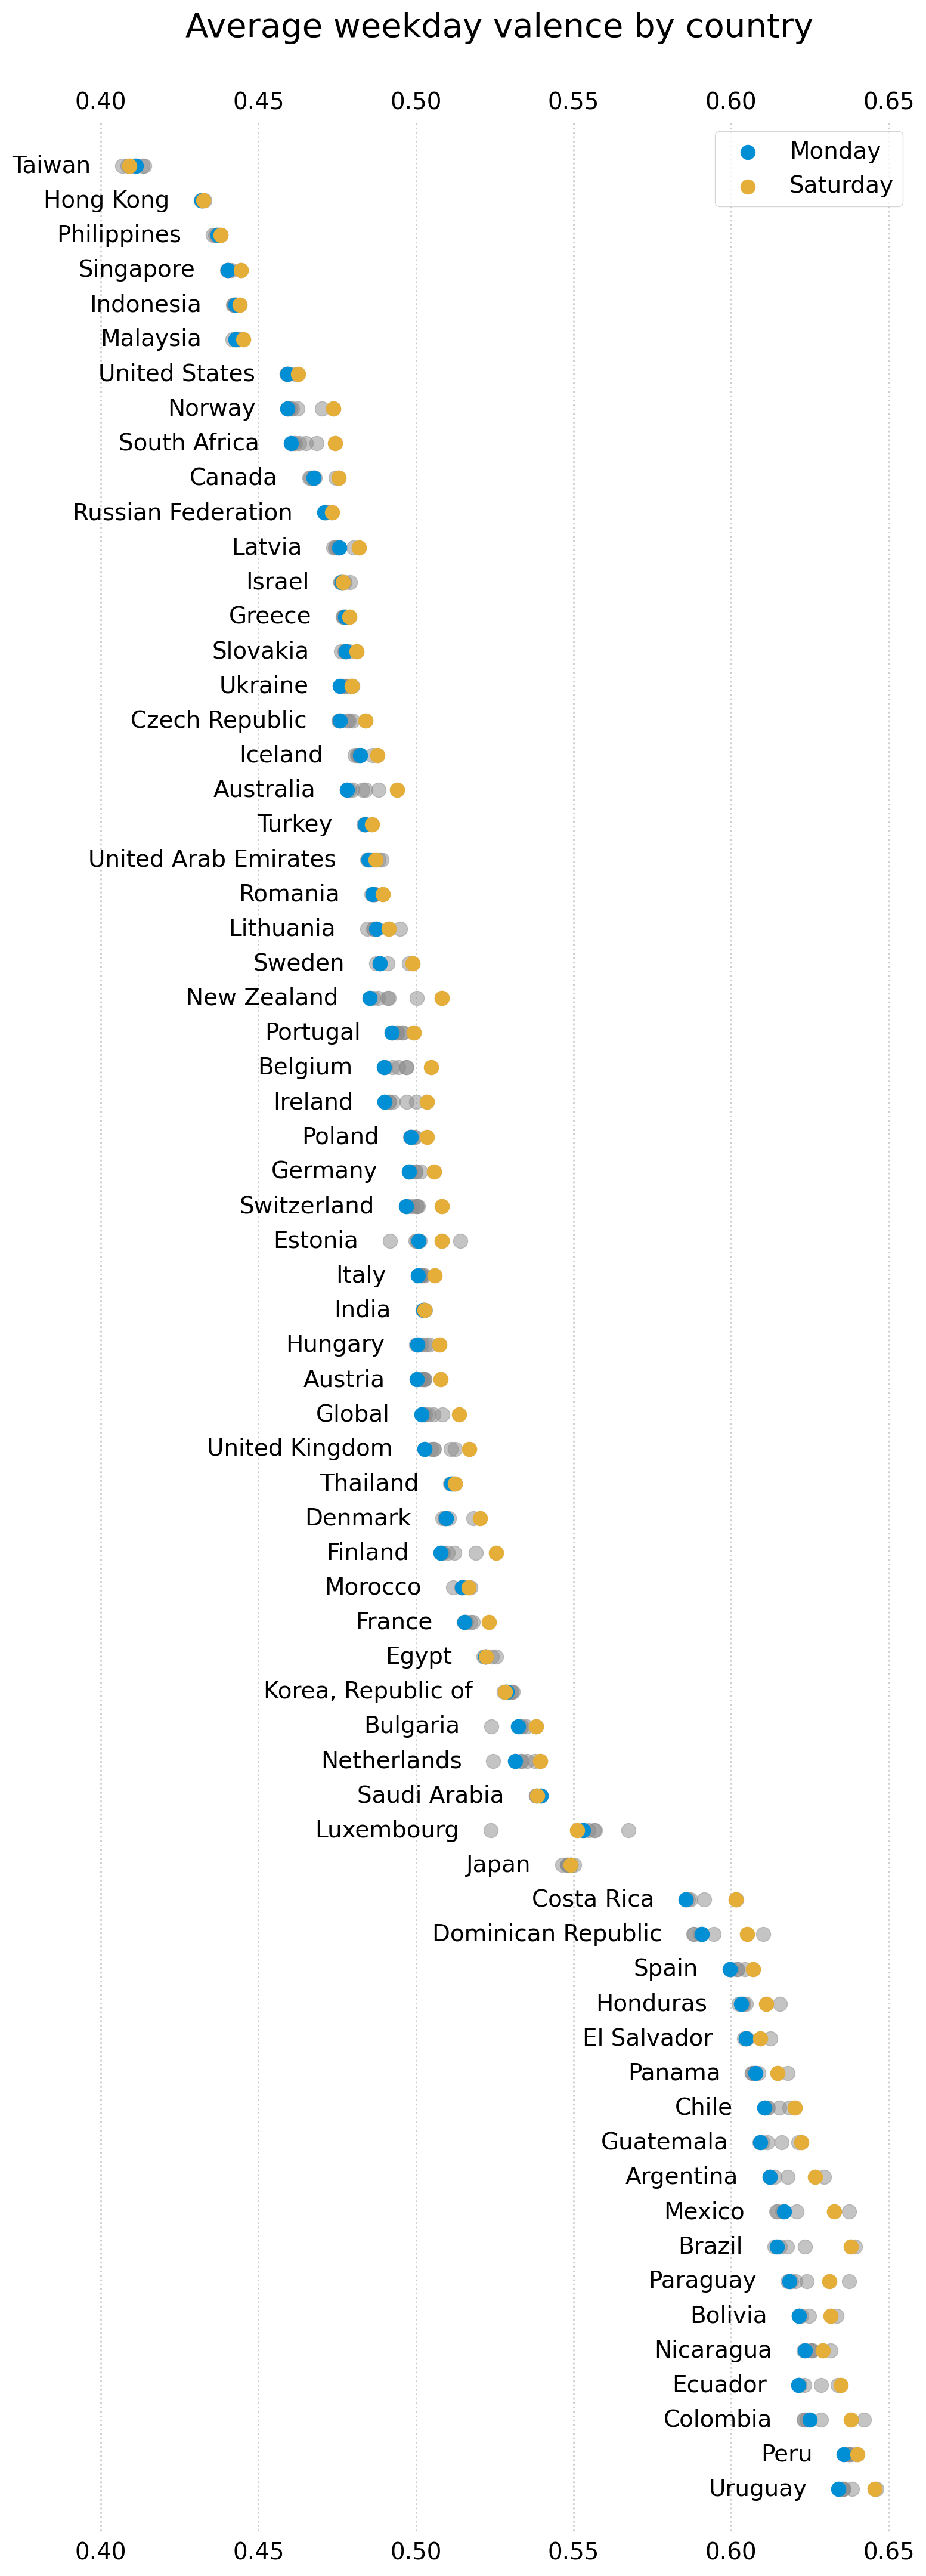
Over all the countries, the happiest weekday is Saturday where Monday is the saddest. Below is a chart showing the mean valence per each weekday in each country.